+1 404 5372266   +1 440 6666786 

Build My System

AMI-300IR

Fully Automatic Chemisorption/TPD Catalyst Characterization by FTIR

AMI 300 IR

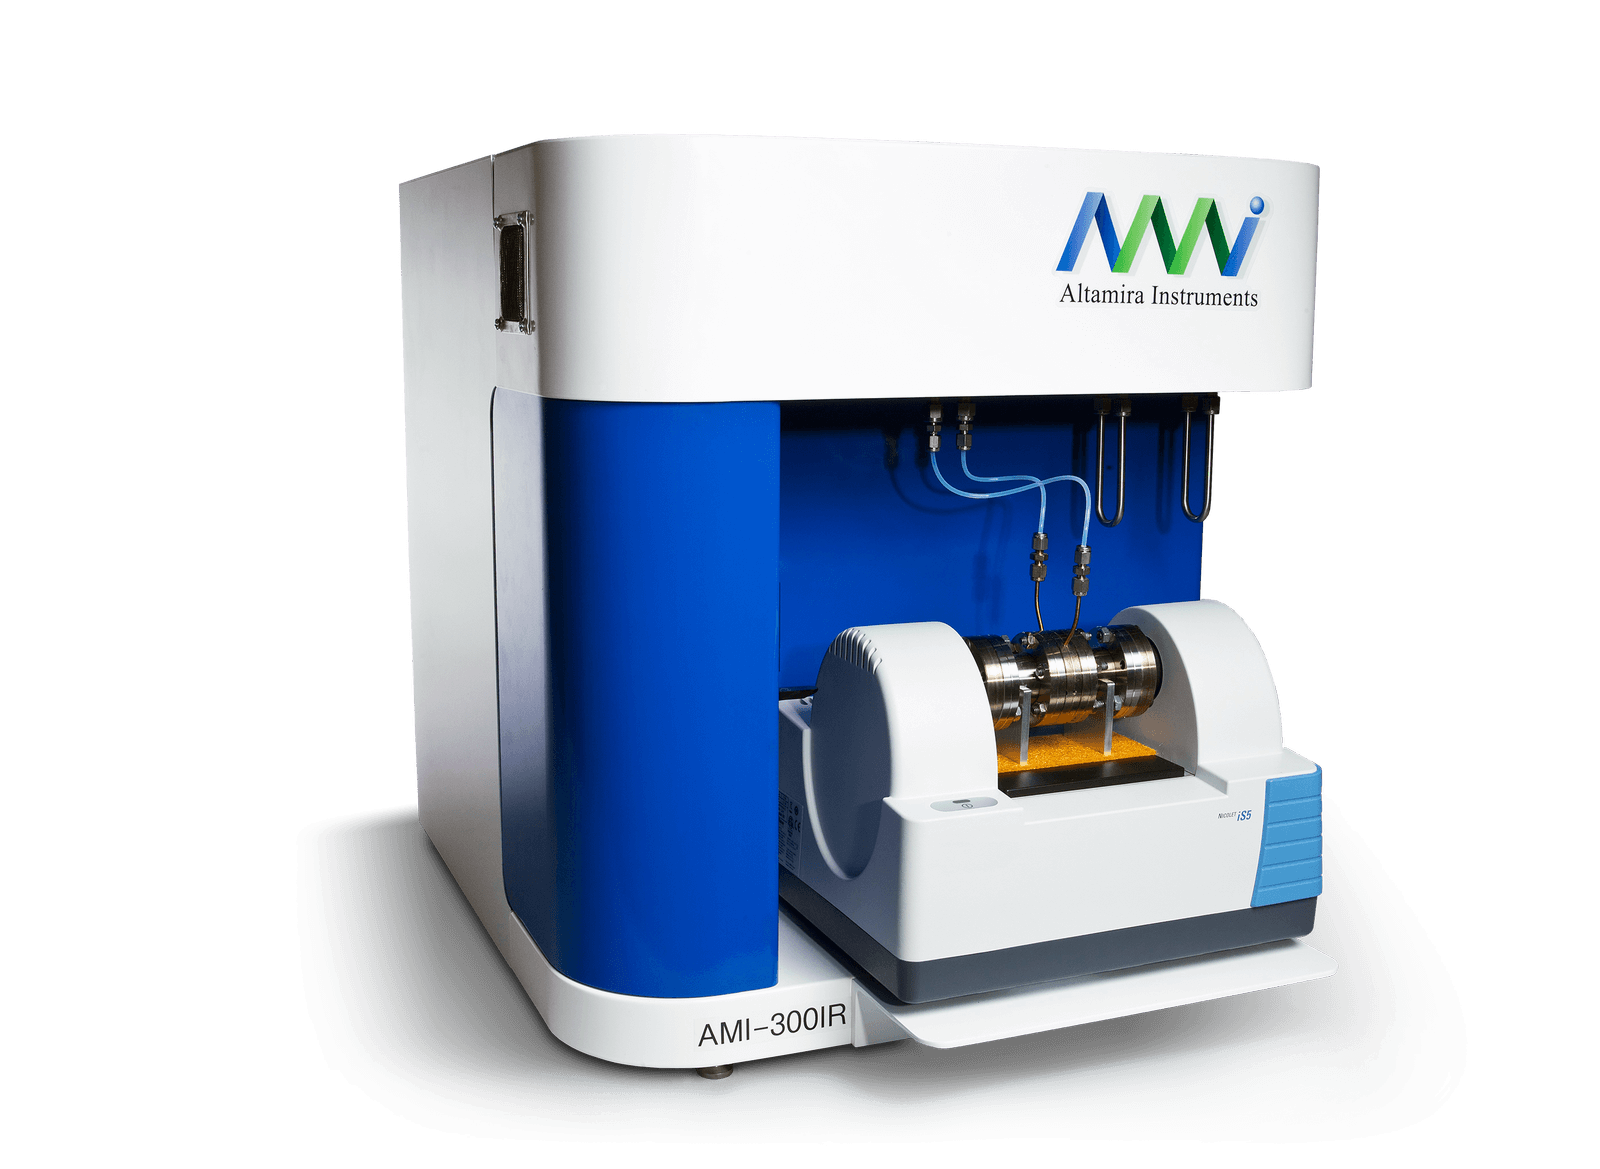
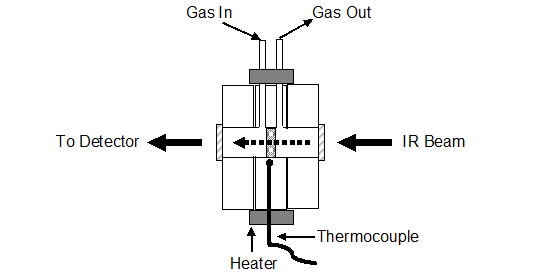
Chemisorption and thermal desorption techniques, such as TPD (temperature programmed desorption), have been widely used for the characterization of catalysts. These techniques rely solely on the observation of evolved gases from a catalyst surface as detected by a thermal conductivity detector (TCD) or, in some cases, a mass spectrometer. With these techniques it is possible to learn about the number and strengths of sites but not about the nature of the sites, the type of adsorption, or whether there exist multiple types of sites. In order to overcome this drawback, Altamira has now developed the AMI-300IR which combines all the standard AMI techniques with real-time observation of the catalyst surface by Fourier Transform Infrared (FTIR) spectroscopy. This combination of techniques allows for the direct observation of the adsorbed species and thus expands the knowledge of the nature of the adsorption/desorption process.

Figure 1. AMI-300IR shown with integrated Thermo Nicolet iS5 FTIR spectrometer

IR Transmission Cells

As part of the development of this new product, Altamira has designed a variety of heated IR transmission cells which fit comfortably into commercial FTIR instruments and which in turn fit into the furnace cavity of a standard AMI-300.

A sample can be prepared in the form of thin, self-supported catalyst wafers by pressing approximately 100 mg of catalyst powder into a disk and then securing it in a proprietary catalyst holder within the IR cell. The IR beam can thus pass through the catalyst wafer. Figures 2 and 3 show a schematic of the cell and a photograph of an actual cell, respectively.

The sample can then be subjected to all the standard AMI-300 procedures while monitoring the catalyst surface and the adsorbates via the IR spectrometer. At the same time, the effluent gas can be monitored using the instrument’s standard TCD or an optional mass spectrometer.

In this manner one can gather information, in real time, as to what is actually occurring on the surface of a sample.

Diagram of IR transmission cell
IR transmission cell. Heaters and insulation have been removed for clarity

Observation of CO Adsorbed on a PT Catalyst

An example of the kind of information that can be obtained with this technique is the mode of adsorption and desorption of CO on a platinum surface. A 1% Pt/Al2O3 catalyst was pressed into a wafer and mounted on an IR cell. The sample was reduced for several hours at 200°C, cooled to room temperature, and then flushed with inert gas for an hour in order to remove the gas-phase and any loosely held CO. The resulting IR spectrum (background subtracted) showed a single sharp line at approximately 2060 cm-1 corresponding to linearly adsorbed CO see figure 4.

Figure 4. IR spectrum of CO adsorbed on a 1% Pt/Al2O3.

Figure 5. CO signal as a function of temperature.

This sample was then heated and the CO band followed as a function of temperature (figure 5). According to Beer’s Law, absorbance is proportional to concentration so from these measurements it is possible to construct an isobar and from it obtain a derived TPD. These are shown in figures 6 and 7, respectively.

Figure 6. Isobar of CO adsorbed on 1% Pt/Al2O3.
Figure 7. Derived CO TPD.

Pulse Chemisorption Detection by IR

IR detection can also be used during pulse chemisorption procedures to ascertain the mode(s) of adsorption at different coverages. Figure 8, below, illustrates CO adsorption on platinum as the coverage increases. Even at low coverages all the CO is adsorbed in a single mode, linearly, and there is no evidence for “bridged” CO. These kinds of observations can only be achieved using IR detection since it involves looking at the actual catalyst surface and not at the evolved gases.

Figure 8. Pulse chemisorption of CO on Pt by FTIR.

Differentiation Between Br酶nsted and Lewis Acid Sites Using Ammonia Chemisorption

Ammonia can be used as a probe molecule to determine the magnitude and type of acid sites in a catalyst. Below, in figure 9, is an example of ammonia adsorbed on a silica-alumina material. Three broad bands were identified as belonging to the adsorbed ammonia, at approximately 1760, 1480, and 1380 cm-1. The band at 1480 cm-1 can be ascribed to ammonia adsorbed on Brønsted acid sites, the others to ammonia adsorbed on Lewis sites (see for example, M. Niwa et al., J. Phys. Chem. B, 110 (2006) p. 264). By carrying out a temperature programmed experiments and following the absorbance of the three bands as a function of temperature it is possible to measure the isobars for each type of adsorption and examine the strength of each particular adsorption. These isobars are shown in figure 10.

It can be seen from these data that the adsorption reflected in the 1380 cm-1 band is more strongly held than the other two perhaps indicating a stronger Lewis-type bond.

Figure 9. Ammonia bands on silica-alumina shown at three different temperatures.
Figure 10. Isobars for each of the three main ammonia bands on silica-alumina

Catalyst Characterization

The AMI-300IR presents an extension of our AMI catalyst characterization instruments which, in various forms, have been manufactured since 1984. The use of real-time FTIR, when combined with our other standard detectors, can now provide the catalyst researcher with not only the number and strengths of sites but also with the nature of the adsorption.